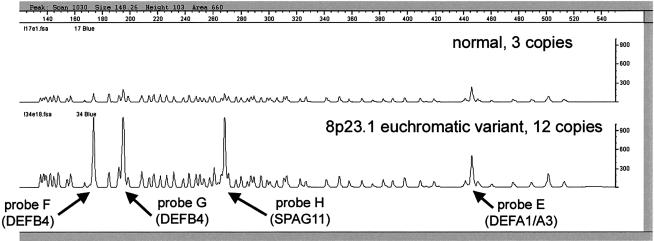
Figure 2.
MAPH analysis of normal control individual and 8p23.1 EV carrier. A MAPH chromatogram shows the analysis of an EV carrier (bottom), with 12 copies of the 8p23.1 repeat unit, and a control DNA sample (top), with 3 copies of the 8p23.1 repeat unit. The X-axis represents probe length (in bp), and the Y-axis represents relative fluorescence units. Each peak represents a different amplifiable probe separated by length. The three probes (F–H) measuring β-defensin–cluster copy number are indicated, together with a probe (E) mapping to DEFA1. Other peaks represent other probes, most of which (47 of the remaining 57) map to single-copy subtelomeric regions and have a copy number of two per diploid genome. The areas of the polymorphic probe peaks (F–H) in the control sample (three copies) are similar to, but slightly larger than, the subtelomeric probe peaks (two copies).

