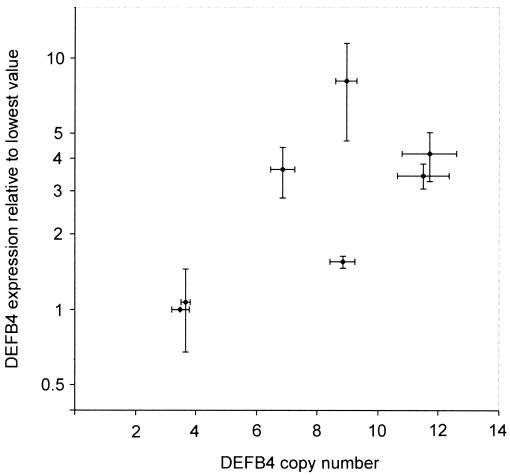
Figure 5.
DEFB4 transcript levels versus β-defensin–cluster DNA copy number for a series of seven lymphoblastoid cell lines. DEFB4 transcript was measured in triplicate by using duplex RT-PCR with TBP as a control transcript. Mean ratio (transformed to log10) ± SEM of DEFB4:TBP intensity ratios is shown on the Y-axis, and MAPH copy number is shown (mean of five tests ± SEM) on the X-axis. There is a significant correlation between DEFB4 transcript levels and β-defensin–cluster copy number (r2=0.5; P<.05). A similar pattern of variation in DEFB4 expression level was also obtained, using G3PD as a control transcript (data not shown).

