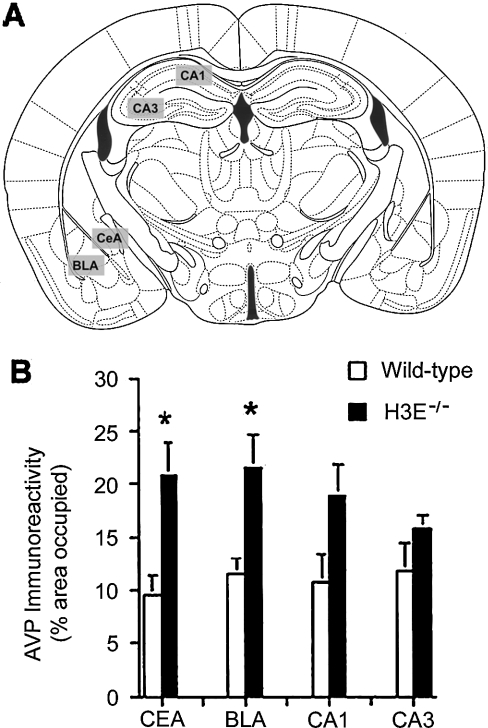
Figure 9. AVP immunoreactivity in the CEA, BLA, CA1 and CA3 of H3R−/− and wild-type mice.
The area occupied by immunolabelled cells (expressed as a percentage of the total image) was determined in the selected brain regions (A). (B) AVP immunoreactivity, expressed as the percentage area occupied, in the CEA, BLA, CA1 and CA3 regions of the brain. *P<0.05; n=5–6 mice per genotype.

