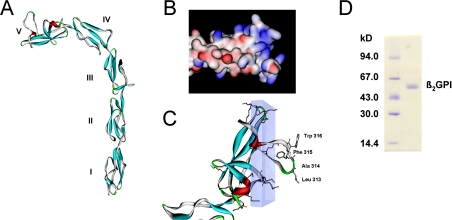
Figure 1. Schematic representations of β2GPI structure and SDS/PAGE.
(A) Crystal structure of β2GPI; domains are numbered from I to V. Crystallographic coordinates were taken from PDB (accession number 1C1Z) [16]. (B) Domain V in a surface potential representation (red, negative; blue, positive; white, uncharged). (C) Detailed structure of domain V. Schematic backbone with α-helix (red) and β-sheet motifs (blue). Residues of the hydrophobic loop and lysine residues are shown in a stick representation. The hydrophobic loop perpendicular to an area containing 11 out of the 14 lysine residues (transparent box) represents the putative phospholipid-binding site. Accelrys DS ViewerPro and POV-Ray were used. (D) Purity of β2GPI samples was verified by SDS/PAGE. The right-hand lane shows the β2GPI band with a molecular mass of approx. 54 kDa; left-hand lane, molecular-mass markers.

