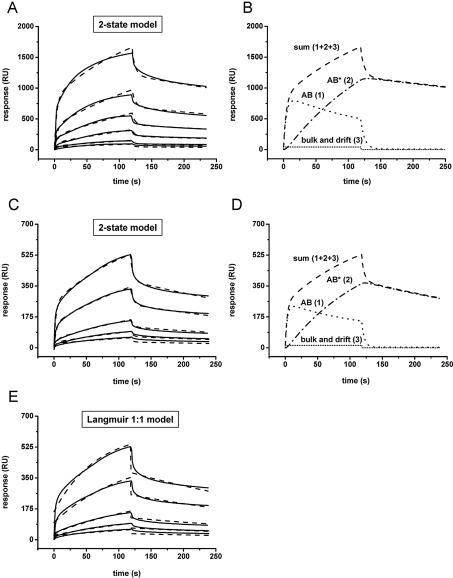
Figure 5. Sensorgrams of β2GPI binding kinetics to POPC/POPS bilayers immobilized on a Biacore L1 chip.
Control experiments with pure POPC vesicles were performed and curves were automatically subtracted. β2GPI was added at t=0 s and pure buffer at t=120 s. Binding curves (——) were measured on a bilayer comprising 80/20 mol% POPC/POPS (A) or 90/10 mol% POPC/POPS (C) with protein concentrations (bottom to top curve) of 50, 100, 250, 500, 1000 and 2500 nM (A) or 250, 500, 1000, 2500 and 5000 nM (C). Fits (–––) were obtained by applying the two-state model. (B, D) An analysis of the fits of the corresponding binding curves measured at the highest protein concentration [2500 and 5000 nM β2GPI, shown in (A) and (C)] (–––, sum of curves 1, 2 and 3) shows the formation of the initial lipid–protein complex (AB,·····, curve 1), the subsequent rearrangement to protein clusters (AB*, –·–·, curve 2) and the bulk and drift effect of the binding (········, curve 3). (E) Binding curves (——) from (C) (10 mol% POPS) fitted by the Langmuir 1:1 model (– – –). Note the significant deviation from raw data at the beginning and end of the protein injection.

