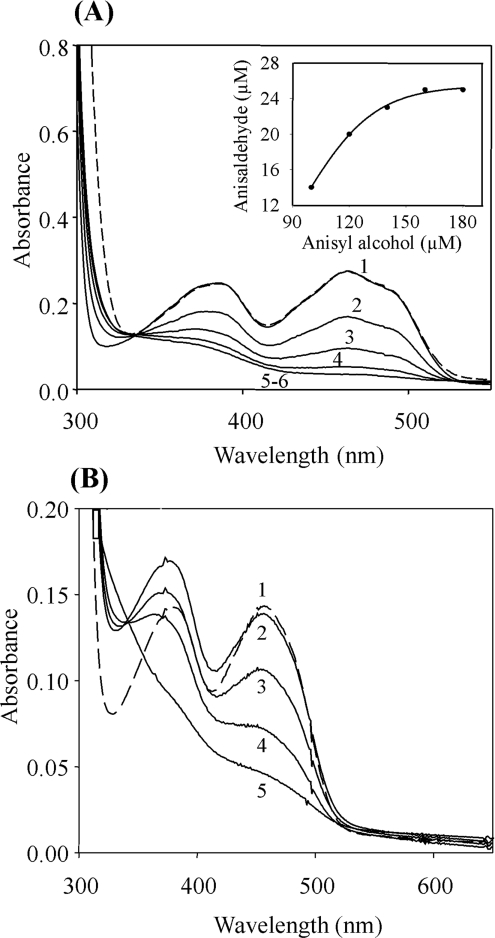
Figure 1. Anaerobic reduction of AAO.
(A) To investigate AAO reduction by substrate, an anaerobic solution of AAO (24 μM) in 100 mM sodium phosphate buffer, pH 6, containing 10 units/ml of glucose oxidase and 310 mM glucose (added anaerobically) was titrated with the following concentrations of p-anisyl alcohol, in 100 mM sodium phosphate buffer, pH 6 (prepared also under anaerobic conditions): 0 μM (trace 1), 100 μM (trace 2), 120 μM (trace 3), 140 μM (trace 4), 160 μM (trace 5) and 180 μM (trace 6). The spectra were corrected for dilution. The initial spectrum of oxidized AAO (trace 1) was recovered after reoxidation with O2 (---). The inset shows the p-anisaldehyde produced during AAO reduction. The aldehyde concentrations (being respectively 14, 20, 23 and 25 μM) were calculated from the increase of absorbance at 298 nm. All spectra were recorded at 24 °C. (B) To investigate AAO photoreduction, an anaerobic cuvette containing an anaerobic solution of AAO (12 μM), EDTA (1 mM) and 5-deazariboflavin (5 μM) in 100 mM sodium phosphate buffer, pH 6 (prepared anaerobically) was irradiated with a 150 W light source at 24 °C. Spectra were recorded before (trace 1, dashed line) and after (trace 2) adding 5-deazariboflavin and EDTA, and after 10 min (trace 3), 20 min (trace 4) and 40 min (trace 5) of subsequent illumination.

