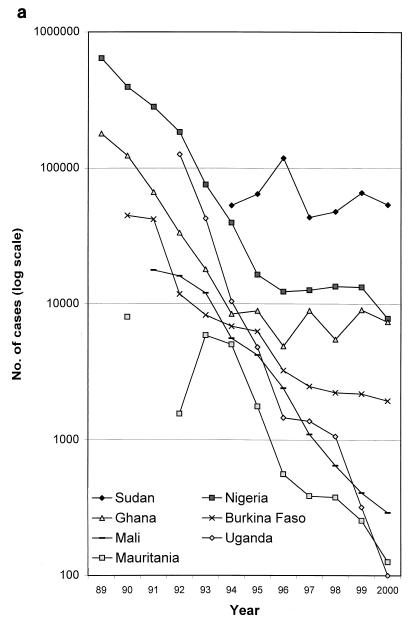
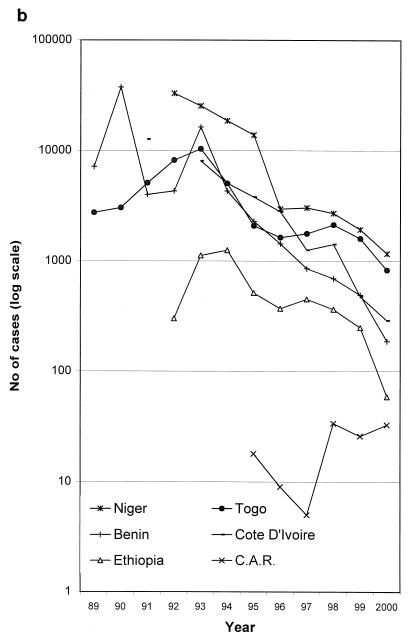
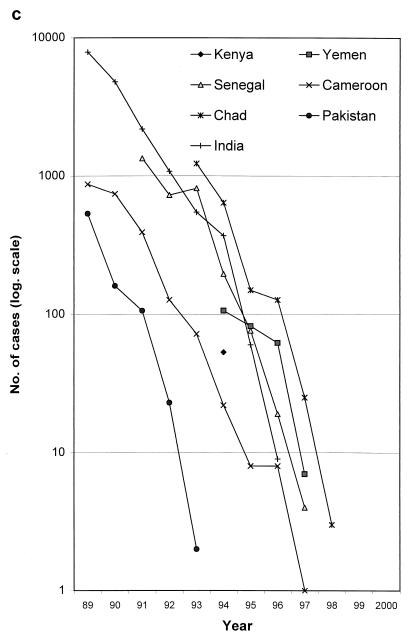
FIG. 8.
The decline in cases of guinea worm disease by country and by year, 1989 to 2000. Note the logarithmic vertical scale. (a) Selected countries of endemicity. The poor performances of Sudan, due to the civil war, and of Ghana and Nigeria in the late 1990s can be seen. (b) The remaining countries of endemicity. The rise in cases in the initial years of some national programs (e.g., Togo and Ethiopia) is attributable to gradual improvements in case detection. C.A.R., Central African Republic. (c) The countries which have interrupted transmission; the last point shown for each country is for the last year in which autochthonous cases were reported. Data are courtesy of WHO.


