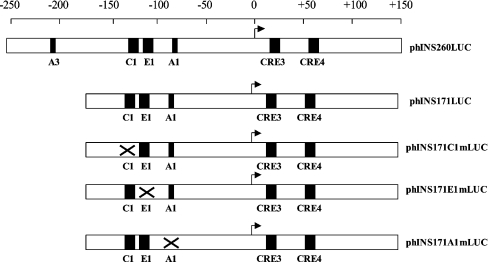
Figure 1. Structure of the human insulin promoter constructs.
Schematic diagram showing the structure of the human insulin promoter constructs. The positions of the A1, A3, C1 and E1 sites are indicated along with the CREs (CRE3 and CRE4) that lie downstream of the transcription start site (arrow). The scale represents base pairs relative to the start site.

