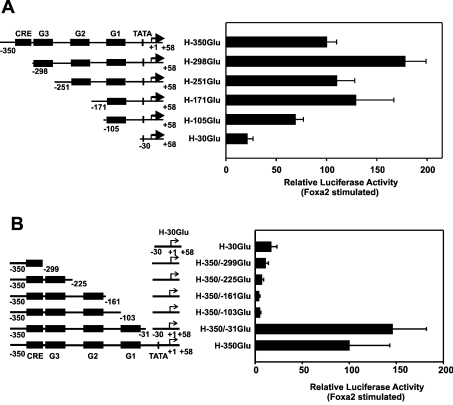
Figure 4. Mapping by 5′- and 3′-deletion analysis of the region imparting transactivation by Foxa2 of the human glucagon gene promoter.
(A) 5′-Deletion analysis. (B) 3′-Deletion analysis. The indicated constructs were transfected into HepG2 cells, both with and without co-transfection of the expression vector encoding Foxa2 (450 ng/dish). The Foxa2-induced luciferase activity is expressed as a percentage of the mean value of the activity measured with H-350GluLuc for each experiment. Values are means±S.E.M. for at least four independent experiments, each performed in duplicate. Potential control elements in the 5′-flanking region of the human glucagon gene are indicated, referring to characterized elements in the rat glucagon gene (see the text for an explanation).

