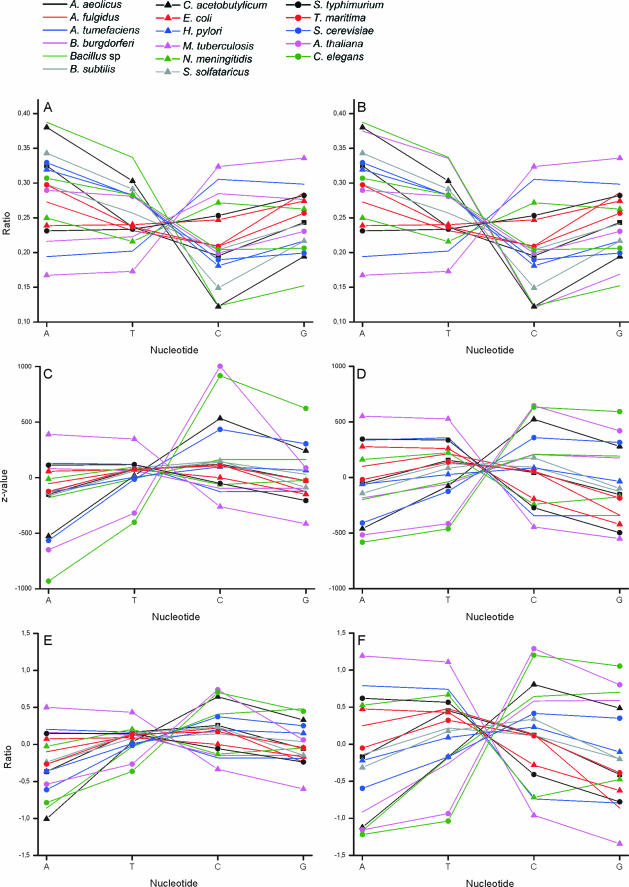
Figure 3.
Nucleotide distribution within oligonucleotides. The ratio of nucleotides in (A) unique oligos in coding region and (B) valid oligos in genome. Z-values for the distribution of nucleotides in (C) unique oligos in coding region and (D) valid oligos in genome. The difference between the nucleotide usage and (E) unique oligos in coding regions and (F) all oligos in genome data.

