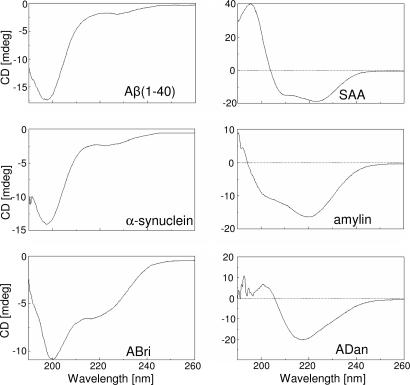
Fig. 1.
CD spectra of mutant amyloid molecules in solution. CD spectrometry analysis of ABri, ADan, α-synuclein, amylin, SAA, and Aβ(1–40) in 5 mM Tris (pH 7.4) was carried out on a Jasco J-720 spectropolarimeter at 1-nm intervals over the wavelength range 190–260 nm at 24°C in a 0.1-cm path-length cell. Results are expressed in molar ellipticity (deg·cm2·mol-1).

