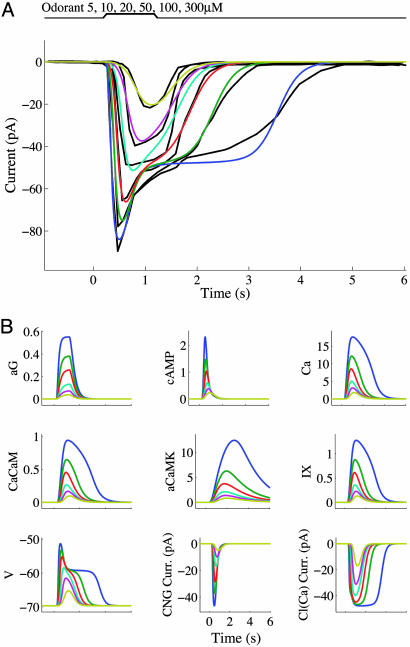
Fig. 1.
Model predictions for stimulation of an ORN with a 1-s odorant pulse of various concentrations as in figure 2A of ref. 30. (A) Simulated receptor currents associated with exposure to 5 (yellow), 10 (purple), 20 (cyan), 50 (red), 100 (green), or 300 (blue) μM cineole, compared with current traces obtained from the experimental data of Reisert and Matthews (30) (black curves). [Black current traces in the image are reprinted with permission from ref. 30 (Copyright 1999, Blackwell Publishing).] (B) Time courses for various quantities in the model as follows: aG, active G-proteins; Ca, intracellular free Ca2+; CaCaM, Ca2+-associated calmodulin; aCaMK, active CaMK; IX, intermediate Ca2+-stimulated substance; V, membrane potential; CNG current; and Cl(Ca) current. The variable bLR (proportion of ligand-bound receptors) is not depicted because its time course closely resembles that of aG. Color coding is the same as in A.

