
Figure 10.
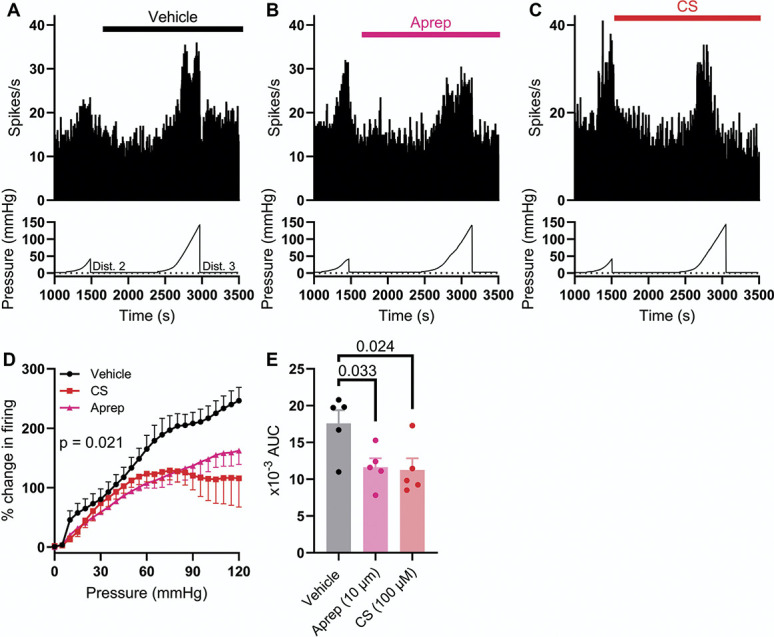
Prolonged colonic distension evoked SP-dependent colonic afferent activity. (A) Example rate histogram (top) and colonic luminal pressure trace (bottom) showing the afferent response to slow ramp distension to 40 mm Hg (Dist. 2) and 120 mm Hg (Dist. 3) in the presence of vehicle (1:1000 DMSO). (B) Example rate histogram (top) and colonic luminal pressure trace (bottom) showing the afferent response to slow ramp distension to 40 mm Hg (Dist. 2) and 120 mm Hg (Dist. 3) in the presence of aprepitant (10 µM). (C) Example rate histogram (top) and colonic luminal pressure trace (bottom) showing the afferent response to slow ramp distension to 40 mm Hg (Dist. 2) and 120 mm Hg (Dist. 3) in the presence of CS (100 µM). (D) Grouped data showing the percentage change in afferent activity during the third ramp distension (to 120 mm Hg) in the presence of vehicle (black), aprepitant (pink), and CS (red). Two-way repeated measures ANOVA with Holm–Sidak post-hoc tests. (E) Grouped data showing the area under the pressure-response curves (AUC) in (D). One-way ANOVA with Dunnett post-hoc tests. CS, cromolyn; SP, substance P.