
Figure 6.
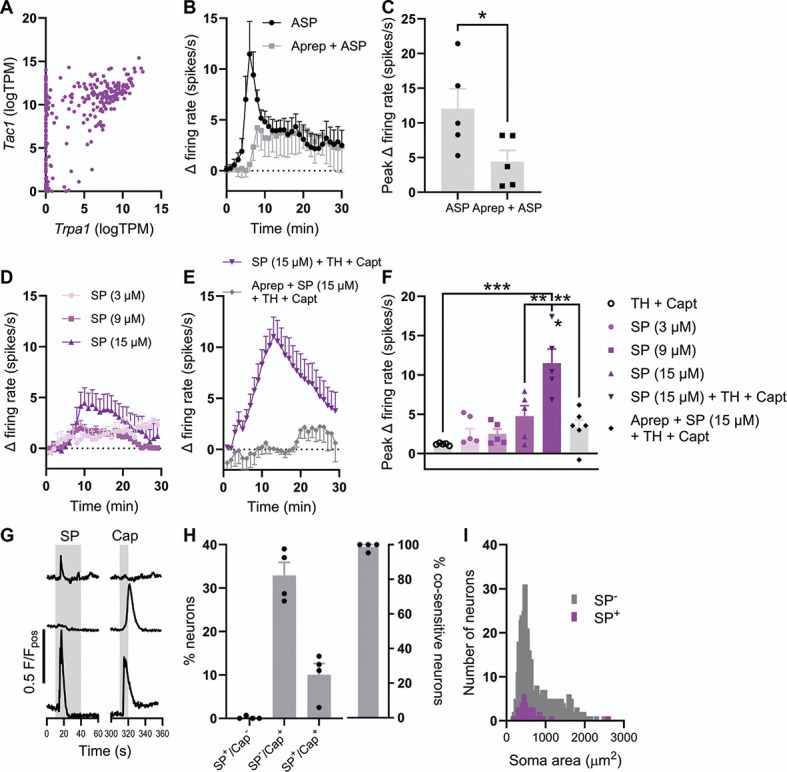
SP stimulates colonic afferents and cultured sensory neurons. (A) Coexpression of Trpa1 and Tac1 transcripts in colonic sensory neurons. Data redrawn from Hockley et al., 2019. (B) Grouped data showing the change in afferent firing rate after the application of ASP7663 (30 µM) alone or after tissue pretreatment with aprepitant (10 µM). (C) Grouped data showing the peak change in afferent firing rate after the application of ASP7663 (30 µM) alone or after tissue pretreatment with aprepitant (10 µM). Two-tailed unpaired t test. (D) Grouped data showing the change in afferent firing rate after the application of 3, 9, or 15 µM of SP. (E) Grouped data showing the change in afferent firing rate after the application of SP with thiorphan (TH) and captopril (Capt) in the absence and presence of aprepitant. (F) Grouped data showing the peak change in afferent firing rate from the experiments shown in (D and E). One-way ANOVA with Bonferroni post-hoc tests. (G) Example Fluo-4 fluorescence traces showing 3 distinct response profiles after the application of SP and capsaicin. (H) (Left) Grouped data showing the proportion of neurons which responded to SP alone, capsaicin alone, or to both SP and capsaicin. (Right) Grouped data showing the proportion of SP-sensitive neurons which were cosensitive to capsaicin. (I) Histogram showing the distribution of sensory neuron soma size for SP-sensitive (purple) and SP-insensitive (grey) neurons. Median soma areas compared using a Mann–Whitney U test. SP, substance P.