
Figure 8.
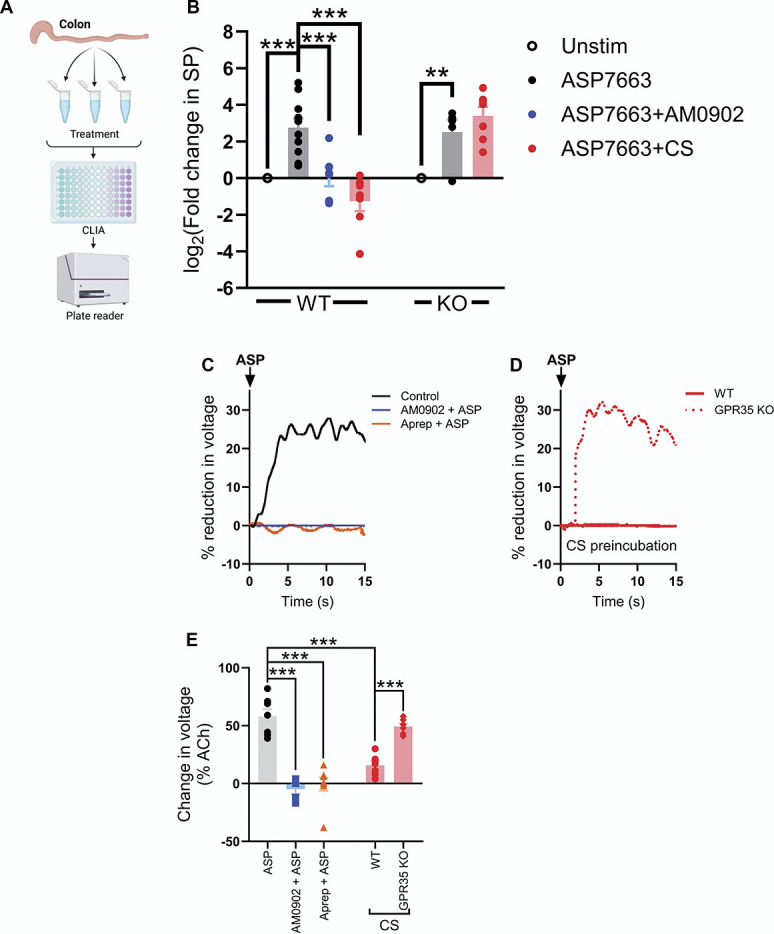
TRPA1 activation evokes SP release in the colon. (A) Schematic showing the experimental protocol for measuring SP release in the colon. (B) Grouped data showing the fold change in SP (relative to a tissue-matched unstimulated control experiment) after incubation of tissue with ASP7663 alone or in the presence of AM0902 or CS in wildtype and GPR35−/− tissue. One-way ANOVA with Bonferroni post-hoc tests. (C) Example recordings showing the reduction in colon length by ASP7663 (shown as a reduction in voltage across a transducer attached to one end of the colon; voltages are shown relative to that evoked by 10 µM of ACh). The effect of ASP7663 was blocked by both AM0902 and aprepitant. (D) Example recordings showing the effect of CS pretreatment on ASP7663-induced colonic contraction in tissue from wildtype and GPR35−/− animals. CS failed to inhibit ASP7663-induced contraction in tissue lacking GPR35. (E) Grouped data showing the peak percentage change in transducer voltage (relative to ACh) for the experiments shown in (C and D). One-way ANOVA with Bonferroni post-hoc tests. CS, cromolyn; SP, substance P; TRPA1, transient receptor potential ankyrin 1.