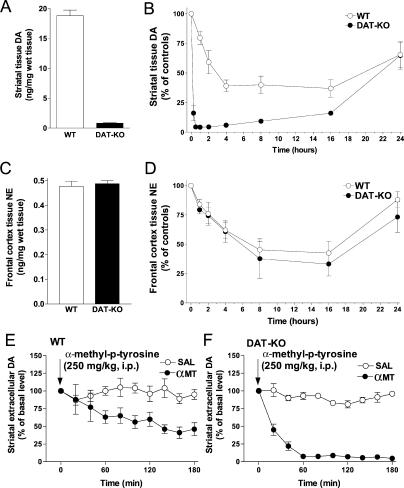
Figure 1. αMT Induces Severe DA Depletion in the Striatum of DAT-KO Mice.
(A) Tissue levels of DA in the striatum of saline-treated control WT and DAT-KO mice (n = 7 per group). Striatal levels of DA were significantly lower in DAT-KO versus WT mice (p < 0.05, Student's t-test).
(B) Dynamics of the effect of αMT (250 mg/kg IP) on striatal tissue DA in WT and DAT-KO mice (n = 5–8 per group). DA levels were significantly lower versus control values at all the time points after αMT treatment in DAT-KO mice and 2–24 hours after treatment in WT mice (p < 0.05, one-way ANOVA followed by Dunnet's multiple comparison test). The magnitude of the effect was significantly different between genotypes from 1 to 16 h after αMT injection (p < 0.05, two-tailed Mann-Whitney U test).
(C) Tissue levels of NE in the frontal cortex of saline-treated WT and DAT-KO mice (n = 7 per group).
(D) Dynamics of the effect of αMT (250 mg/kg IP) on tissue levels of NE in the frontal cortex of WT and DAT-KO mice (n = 5–8 per group). NE levels were significantly lower versus control values at time points 2–16 after αMT treatment in DAT-KO mice and at 4–16 hours after treatment in WT mice (p < 0.05, one-way ANOVA followed by Dunnet's multiple comparison test). The magnitude of the effect was not different between genotypes at any time point after αMT injection (p > 0.05, two-tailed Mann-Whitney U test).
(E) Effect of αMT on extracellular DA levels in the striatum of WT mice, measured using in vivo microdialysis. Data are presented as a percentage of the average level of DA measured in at least three samples collected before the drug administration. (Saline, n = 5; αMT, n = 7). αMT significantly decreased DA levels 60–180 min after treatment (p < 0.05, two-tailed Mann-Whitney U test versus respective time points in saline-treated controls).
(F) Effect of αMT on extracellular levels of DA in the striatum of DAT-KO mice, measured by using in vivo microdialysis in freely moving mice. Data are presented as a percentage of the average level of DA measured in at least three samples collected before drug administration. (Saline, n = 4; αMT, n = 6). αMT significantly decreased DA levels 20–180 min after treatment (p < 0.05, two-tailed Mann-Whitney U test versus respective time points in saline-treated controls). Analysis of area under curve values for 120-min periods after drug administration revealed significant difference between DAT-KO and WT groups (p < 0.05, two-tailed Mann-Whitney U test). Note also that the basal extracellular levels of DA in DAT-KO mice were significantly higher than in WT mice (predrug concentrations of DA in dialysates were: WT, 76 ± 17 fmol/20 μl; DAT-KO, 340 ± 63 fmol/20 μl).

