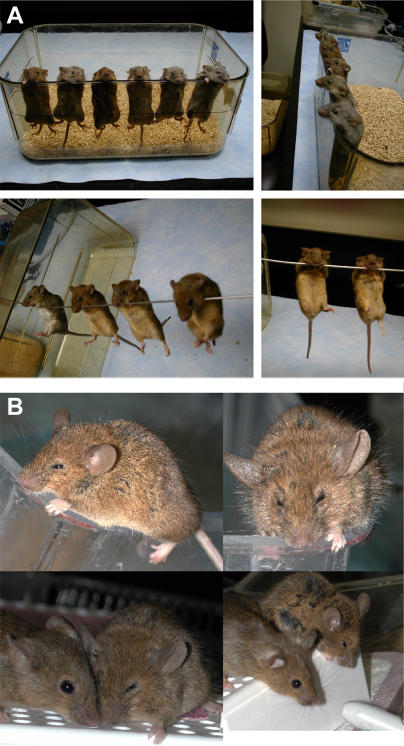
Figure 2. Display of Behavioral Phenotypes of DDD Mice.
(A) Akinesia and rigidity of DDD mice. Photos were taken 30 min after treatment of DAT-KO mice with αMT (250 mg/kg IP).
(B) Ptosis in DDD mice. Photos were taken 3 h after treatment of DAT-KO mice with αMT (250 mg/kg IP). Lower panel: Mouse on the left side is saline-treated DAT-KO mouse, whereas the mouse on the right side is αMT-treated DAT-KO mouse.

