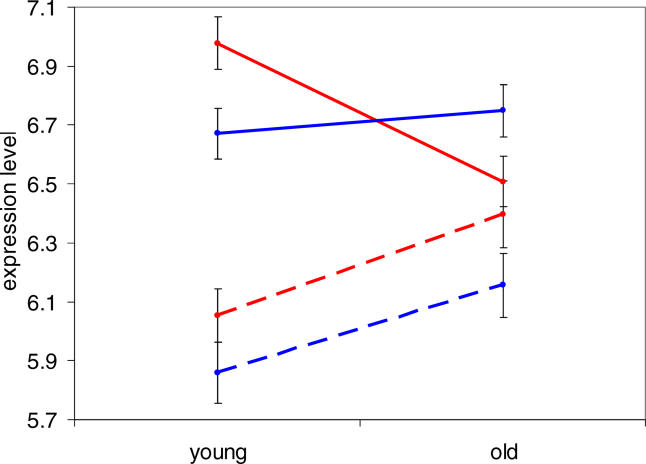
Figure 3. Expression Levels in Human Cortex and Cerebellum.
Average expression levels (base two logarithm expression intensity; error bars indicate plus or minus one standard error) in prefrontal cortex were calculated for four sets of genes in both young (two 45-y-old) and old (one 70-y-old) human samples. Red indicates cortex expression levels; blue, cerebellum expression levels; solid lines, genes down-regulated in frontal pole; and dashed lines, genes up-regulated in frontal pole (connecting lines are not meant to imply linear changes in gene expression with age). The genes up-regulated with age in cortex are somewhat up-regulated in cerebellum, whereas those down-regulated in cortex do not change at all with age in cerebellum.

