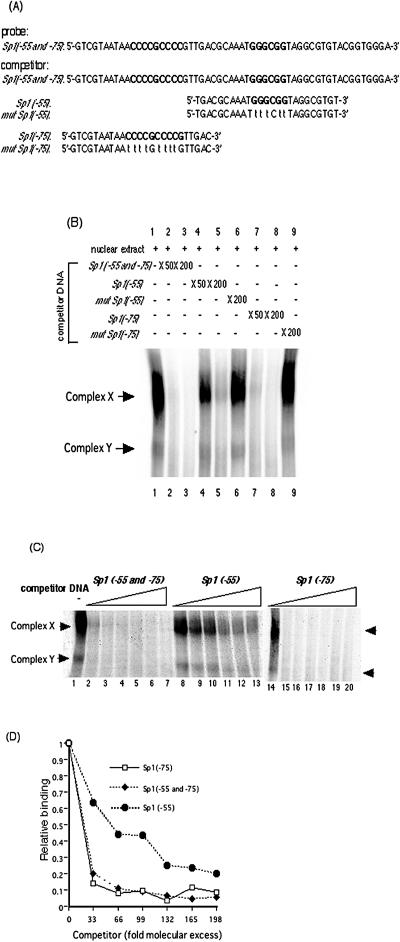
FIG. 3.
Binding activity of Sp1/Sp3 transcription factors to Sp1(−75) and to Sp1(−55). (A) DNA sequences of 32P-labeled probe containing both Sp1(−55) and Sp1(−75) and competitor dsDNAs containing Sp1(−55 and −75), Sp1(−55), mutated Sp1(−55), Sp1(−75), or mutated Sp1(−75). The probe and the competitor dsDNAs were generated as described in Materials and Methods. (B) Autoradiogram of competitive EMSA. Competitive EMSAs were performed using 32P-labeled Sp1(−55 and −75) containing both GC boxes as a probe and the indicated excess of each competitor dsDNA as described in Materials and Methods. Lanes contain the following: probe plus nuclear extract (lane 1), probe plus nuclear extract in the presence of a 50- or 200-fold molar excess of Sp1(−55 and −75) DNA (lanes 2 and 3, respectively), probe plus nuclear extract in the presence of a 50- or 200-fold molar excess of nonradioactive Sp1(−55) DNA (lanes 4 and 5, respectively), probe plus nuclear extract in the presence of a 200-fold molar excess of nonradioactive mutated Sp1(−55) DNA (lane 6), probe plus nuclear extract in the presence of a 50- or 200-fold molar excess of nonradioactive Sp1(−75) DNA (lanes 7 and 8, respectively), probe plus nuclear extract in the presence of a 200-fold molar excess of nonradioactive mutated Sp1(−75) DNA (lane 9). (C) Binding affinity of the transcription factors for Sp1(−55) and Sp1(−75) examined quantitatively by competitive EMSA. The probe for Sp1(−55 and −75) was incubated with nuclear extracts in the absence or presence of increasing concentrations (33-, 66-, 99-, 132-, 165-, and 198-fold molar excesses) of Sp1(−55 and −75), Sp1(−55), or Sp1(−75) nonradioactive competitor DNA. Lanes contain the following: probe in the absence of competitor DNA (lanes 1 and 14), 33-fold molar excess of competitor DNA (lanes 2, 8, and 15), 66-fold molar excess of competitor DNA (lanes 3, 9, and 16), 99-fold molar excess of competitor DNA (lanes 4, 10, and 17), 132-fold molar excess of competitor DNA (lanes 5, 11, and 18), 165-fold molar excess of competitor DNA (lanes 6, 12, and 19),and 198-fold molar excess of competitor DNA (lanes 7, 13, and 20). (D) Quantification of complex X and Y formation shown in panel C. Intensities were assessed with a BAS2500 (Fuji) image analyzer as described in Materials and Methods. The results are expressed as ratios of binding in the absence of competitor DNA.

