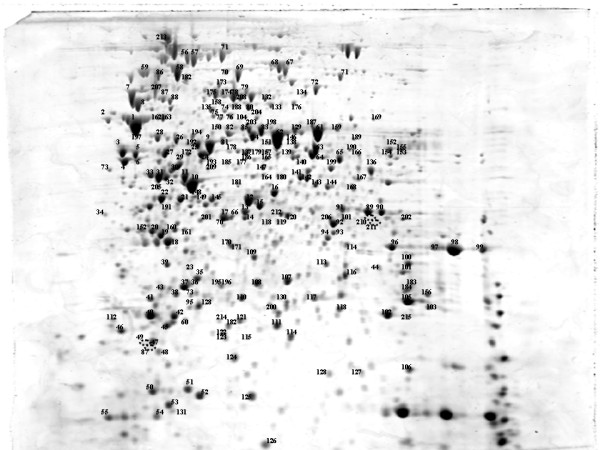
Figure 1.

Annotated reference map of the cytosolic proteins of S. enterica serovar Typhimurium. Separation was performed with 18 cm pH 3–10 NL IPG strips and 10 % Duracryl gels. Spots were visualised with SYPRO Ruby and imaged with a Typhoon Scanner (Amersham Biosciences, UK). The labelled spots were excised and analysed by LC/MS/MS, (Additional file 1). The empty circles represent spots detected only in the profile of serovar Pullorum.
