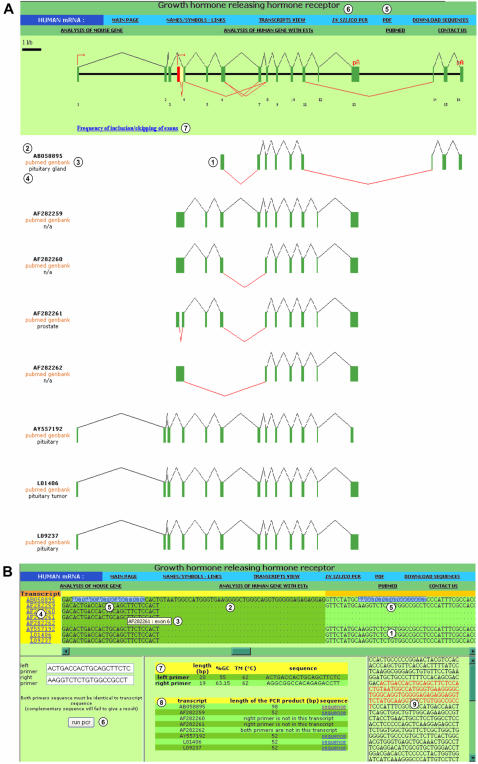
Figure 2.
Graphical representation of GHRHR transcripts, navigation banner and in silico PCR. (A) Graphical representation of GHRHR transcripts. (1) Graphical representation of transcript aligned with the gene graphical representation; (2) transcript accession number; (3) links to Genbank and Pubmed; (4) name of the tissue where the transcript was cloned; (5) link to the PDF version of the current GHRHR analysis; (6) link to the multi-alignment of the GHRHR transcript sequences and in silico PCR; (7) for each exon, number of transcripts that include/skip the exon. (B) In silico PCR. (1) Multi-alignment of all GHRHR transcripts performed exon by exon; (2) variable sequence found in one transcript due to an alternative 5′-splice site; (3) current exon and name of the current transcript displayed by pointing the cursor on the corresponding sequence for a few seconds; (4) transcript accession numbers linked to an alignment of the corresponding transcript sequence with the genomic sequence; (5) selection of sequences for PCR primers directly on the multi-alignment; (6) selected PCR primer sequences pasted in the corresponding boxes to run in silico PCR; (7) length, GC% content, Tm and 5′–3′ sequence of the selected primers; (8) length of the expected PCR product for each transcript and link to its sequence; (9) sequence of the PCR product within the sequence of the template transcript.

