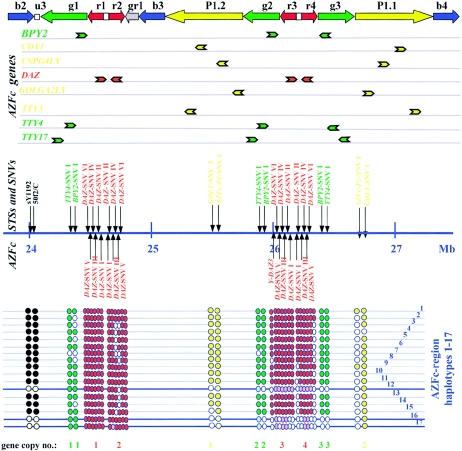
Figure 1.
Schematic view of the AZFc locus, showing its gene content and the locations of the STSs and SNVs used in this study. The AZFc amplicon structure is drawn according to the color code of Kuroda-Kawaguchi et al. (2001). AZFc genes are listed below the amplicon structure, with their 5′→3′ polarities indicated by the directions of the arrows. The STSs and SNVs used in this study are shown below the gene map. Their GenBank accession numbers and molecular data are listed in the work of Fernandes et al. (2002) and in table 1, respectively. All AZFc markers and genes were mapped onto the Ensembl Y-chromosome-sequence between 23.79 and 27.49 Mb. With the complete b2 and b4 amplicons included, a length of ∼3.7 Mb for the AZFc sequence was estimated. The presence or absence of an STS or SNV in the genomic DNA samples analyzed could be grouped into 17 patterns (AZFc deletion haplotypes 1–17). These are symbolized below the STS/SNV map by rows of filled or empty circles, with the gene copies numbered at the bottom of the figure. Thick lines represent deletion haplotypes belonging to haplogroup N. The pale colors of some circles indicates that these multilocus SNVs were inferred to be absent because all unambiguously typed flanking and intervening markers were absent.

