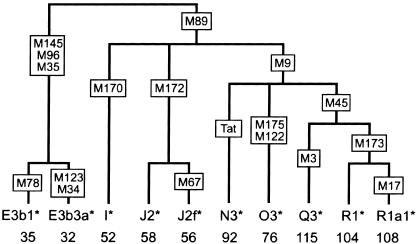
Figure 3.
Phylogeny of the Y chromosomes analyzed in this work. Selected Y-SNPs are shown in boxes, and the haplogroup names according to the YCC (2002) or Underhill et al. (2000) are shown at the bottom. Only the haplogroups present in the samples analyzed are included. The phylogeny represents the branching order, but not timescale. In accordance with the YCC convention, haplogroups that may not be monophyletic (paragroups) are labeled with an asterisk (*).

