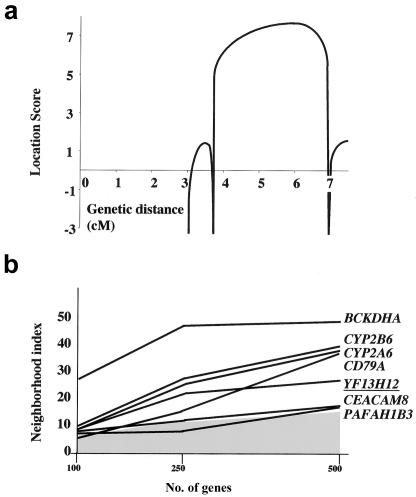
Figure 3.
Genetic findings. a, Multipoint analysis of the EE locus for the families shown in figure 2. b, Integrative genomics strategy based on calculation of the mitochondrial neighborhood index. On the X-axis is shown the number of genes with expression profiles that were considered for the calculation of the index. The graph reports the values obtained for genes (UCSC annotation) from the 19q13 EE locus for which scores were equal to or higher than a threshold (gray area) corresponding to the score reported by Mootha et al. for the LRPPRC gene. YF13H12 (underlined) corresponds to a partial-length ETHE1 cDNA.

