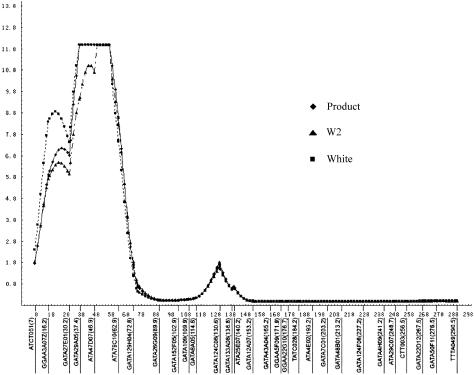
Figure 2.
Identification of a novel genetic linkage for MI on chromosome 1p34-36. The vertical axis represents  or pP, and the horizontal axis denotes the distance (cM) for markers along the chromosome. The results were obtained by multipoint linkage analysis of 2-cM intervals, through use of the SAGE package. The asymptotic P values were quoted accurately to only 12 decimal places, resulting in a flat pP peak.

