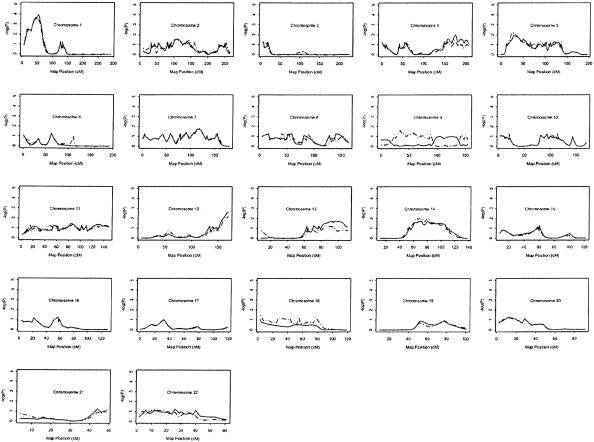
Figure 3.
Evaluation of linkage results (asymptotic P value) by use of permutation tests. Up to 100,000 permutations were performed to obtain the empirical P value at each locus by use of the SAGE program SIBPAL. The vertical axis represents  or pP, and the horizontal axis denotes the genetic distance (cM) for each chromosome. The solid curve indicates the empirical linkage profile for all pedigrees; the dashed line denotes the empirical linkage profile for white pedigrees only.

