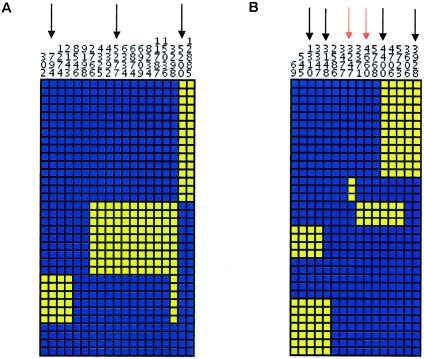
Figure 5.
Visual depiction of the common haplotypes inferred from SNPs with MAF >5% in IL1B from the ED population (a) and CSF2 from the AD population (b). Each column represents a SNP, with the minor allele colored yellow and the common allele colored blue. Each row represents a chromosome. Sites within the gene were clustered on the basis of allelic similarity, and haplotypes were clustered using the unweighted pair group method with arithmetic averages. a, Four common haplotypes (>5% frequency) were observed in the ED population for IL1B from all common variation at MAF >5%. The black arrows represent tagSNPs that distinguish the four common haplotypes whose corresponding sites were also found among the coding variation data set. b, Six common haplotypes (>5% frequency) were observed in the AD population for CSF2 from all common variation at MAF >5%. Six tagSNPs were identified that distinguish common haplotypes. The black arrows represent the tagSNPs that distinguish common haplotypes whose corresponding sites were also found among the coding variation data set. The red arrows represent the tagSNPs that distinguish common haplotypes whose corresponding sites were not found among the coding variation data set.

