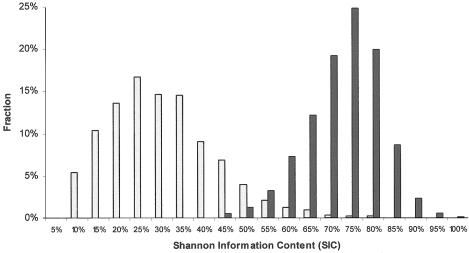
Figure 1.
Power of the individual 2,154 MALD markers (white bars), as a fraction of the maximum (power is calculated by eq. [1]). Power increases strikingly when the methods described by Patterson et al. (2004 [in this issue]) are used to combine data from multiple, closely linked markers (black bars).

