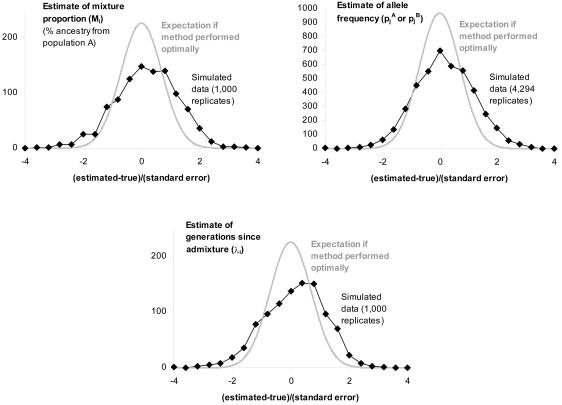
Figure 5.
Difference between the true values of Mi, λi, pAj, and pBj and the estimates from the MCMC. These results are obtained by simulating data sets in which 1,000 samples are genotyped in 2,147 markers from the map described by Smith et al. (2004 [in this issue]). In the simulations, we set Mi=20%±12% and λi=6±2, to match the values observed empirically in African Americans, and we assume no disease locus. The difference between the true value and estimate (divided by the estimated SE estimated by the MCMC) is, on average, close to 0, indicating that the estimates are unbiased. Compared with normal theory, the residuals are larger than expected, indicating that the MCMC slightly underestimates the SEs, although this does not appear to cause false positives (table 2).

