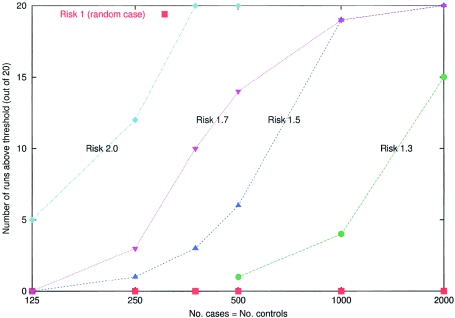
Figure 6.
Simulations to assess the power of the method to detect a disease locus at which a population A–ancestry allele confers 1-, 1.3-, 1.5-, 1.7-, and 2-fold multiplicative increased risk. The ancestry of the samples was assumed to be Mi∼20%±12% and λi∼6±2, and the markers are 2,147 from the map described in the accompanying article by Smith et al. (2004 [in this issue]). For the simulations, we picked a “typical” locus from the map (chromosome 8, position 131 cM), where the estimated information about ancestry provided by nearby markers (estimated as described by Smith et al. 2004 [in this issue]) is 67% of the maximum. For each of the five risk models and sample sizes of 250, 500, 750, 1,000, and 2,000 (assuming equal numbers of cases and controls), 20 simulations were performed. The number of simulations that pass the genomewide threshold of significance (LOD >2) was plotted for the main locus-genome statistic (we used a hypothesis of equally likely risk models of ψ1=0.5, 1.3, 1.5, and 2.0, with ψ2=ψ21 in the locus-genome tests for association). These simulations demonstrate that even relative risks due to ancestry of as little as 1.3 can be detected by admixture mapping with 2,000 cases and controls. The significance threshold we use (LOD >2) is quite stringent, so, in practice, many simulations that do not formally exceed this significance threshold will produce large enough scores (LOD >0) that they would be followed up by studying a higher density of markers at the strongest peaks of association. Extraction of substantially more information by genotyping a higher density of markers should bring real disease loci above the genomewide threshold of significance.

