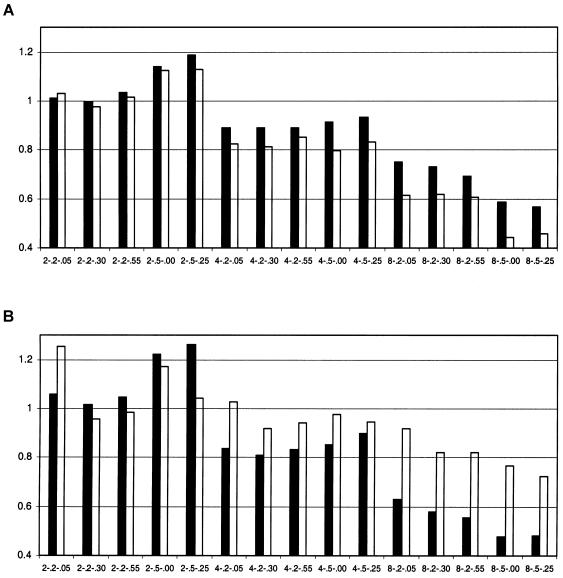
Figure 2.
Ratio of NCP values, calculated from the empirical mean divided by those from the empirical variance of the test statistic. The labels on the X-axis are in the format of s-h2QTL-h2PG, where s is the sibship size. A, Comparison between the HE (blackened bars) and VH (unblackened bars) methods. B, Comparison between the SR (blackened bars) and VC (unblackened bars) methods.

