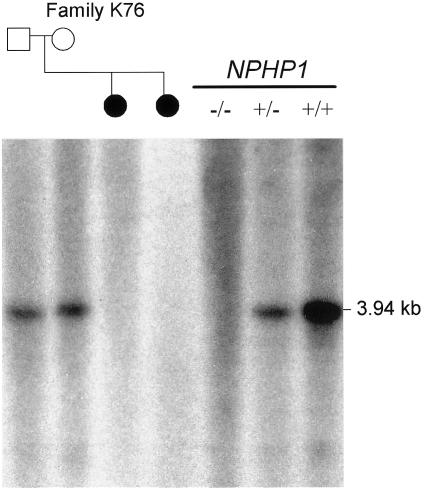
Figure 2.
Southern analysis of EcoRI-digested genomic DNA from members of family K76 and from control subjects, confirming the presence of a homozygous deletion of NPHP1 in the two affected daughters (blackened circles). The probe is a 405-bp PCR fragment, including exons 9–10 (forward primer: 5′-TGGAAAGCAAGTTCTTAGTAAGCAGCG-3′, reverse primer: 5′-GGCAGAATTTGGACTTGCTACCTTGA-3′). The number of wild-type alleles in control samples is indicated by the genotype symbols underneath the black line (below “NPHP1”). Dosage is apparent by intensity of the 3.94-kb band that hybridizes to the intragenic NPHP1 probe. A ß-actin control probe detected a band of almost equal intensity for all samples, confirming equal loading of DNA (data not shown).

