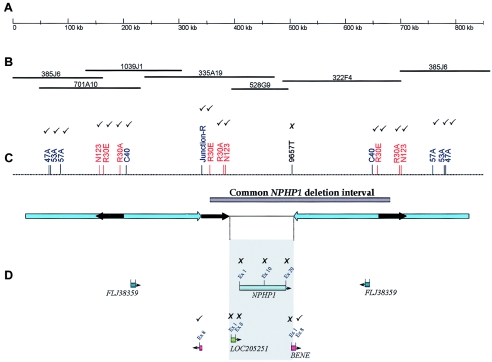
Figure 4.
Comparison of the NPHP1 deletion in subjects with JS (K76-1 and K76-2) and in a control subject with the classic deletion (K84-1). The results of STS deletion mapping are indicated in C and D as ticks (to indicate the marker was present in these three subjects) and crosses (to indicate the marker was absent in all three subjects). A, Scale bar indicating 850 kb of contiguous DNA sequence at 2q13, isolated from the UCSC genome browser. B, BAC clone contig of the interval. (Note that clone 385J6 flanks both ends, demonstrating the difficulty presented by genomic duplications in generating accurate contigs.) C, Map of STS markers in the region that was used for deletion mapping. The NPHP1 deletion interval is indicated by a gray bar, and arrow diagrams outline the repeat regions: large blue arrows indicate the 330-kb inverted repeat, and short black arrows indicate the three copies of the 45-kb repeat, of which the two direct repeats are known to mediate unequal crossover. D, Gene locations included within the region encompassing the 45-kb repeats, mapped with orientation indicated by arrowheads. The shaded gray box indicates the only unique DNA sequence of the deleted region, which includes LOC205251, NPHP1, and all but the 3′ portion of the BENE gene.

