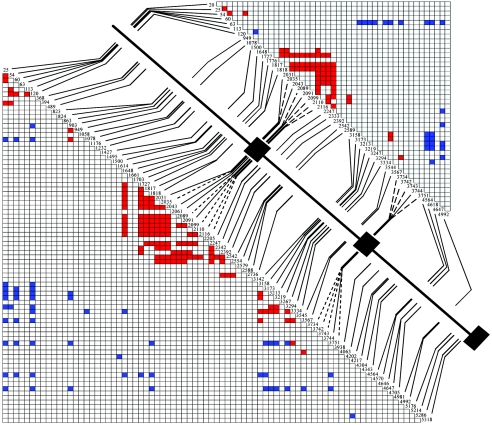
Figure 2.
Diagram of sequenced 5.5-kb OPN1LW region with LD plots. The large black boxes are exon 3 (169 bp), exon 4 (166 bp), and partial exon 5 (121 bp), which are separated by introns 2 (1,987 bp), 3 (1,467 bp), and 4 (1,554 bp). Dashed lines are replacement SNPs. Plots represent pairwise associations among the 78 variants from the 163 Africans (bottom half) and among the 46 variants from the 73 non-Africans (top half). Red and blue blocks are pairwise associations that exhibit significantly less LD and significantly more LD, respectively, than expected on the basis of the ML estimate of ρMAF (see the “Subjects and Methods” section).

