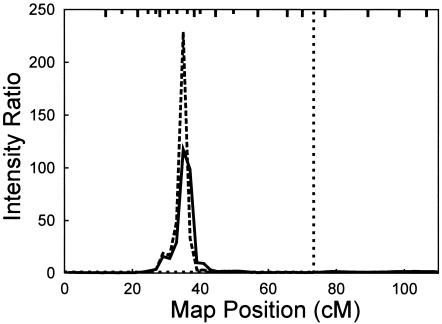
Figure 2.
MCMC multipoint linkage analysis, with 21 markers plus APOE, which was used as both a marker and a major-gene covariate. The solid line indicates τβ=100, and the dashed line represents τβ=200. The vertical light dotted line shows the location of APOE. APOE genotypes were inferred probabilistically for all individuals with missing genotypes, and age at onset was estimated for all six APOE genotypes. Tick marks on the top horizontal axis indicate marker locations, with long ticks corresponding to the same markers as in figure 1 and short ticks corresponding to an additional nine markers. From left to right, the markers are D19S209, D19S894, D19S216, D19S869, D19S395, D19S884, D19S391, D19S916, D19S394, D19S221, D19S914, D19S564, D19S226, D19S915, D19S414, D19S220, D19S420, D19S902, D19S571, D19S418, and D19S210. (Markers D19S221 and D19S914 are so close together that the ticks are indistinguishable.)

