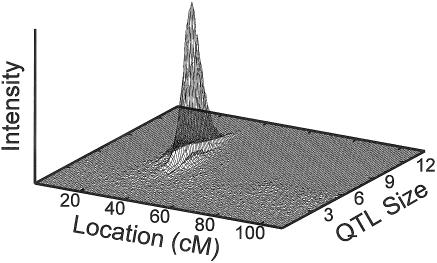
Figure 3.
Results from run with τβ=100 in figure 2, showing position and genetic effect of the 19p linkage signal relative to the background signal. The vertical axis is proportional to the posterior probability of a gene at a particular location (the intensity) and with the indicated QTL size (square root of the genetic variance).

