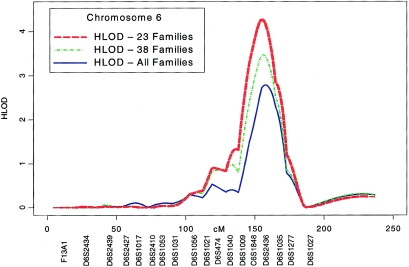
Figure 3.
Plot of chromosome 6 parametric multipoint HLOD scores (affected-only dominant model, no environmental covariates) calculated by SIMWALK2, in all 52 families (HLOD-All), in the 38 families with four or more affected individuals (HLOD-38), and in the 23 multigenerational families with five or more affected individuals (HLOD-23).

