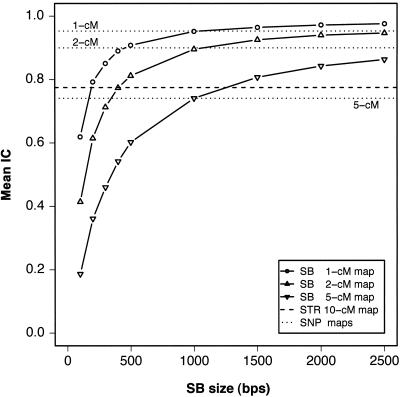
Figure 1.
Average IC as a function of SB size and interval length. Curves correspond to data sets with a constant interval and varying SB size; the lines are visual guides. Each point represents the mean of 1,000 simulated instances. The horizontal dotted lines depict the IC expected from conventional genotyping techniques based on STR or SNP markers.

