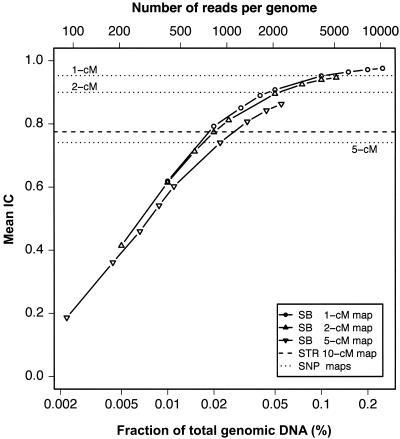
Figure 2.
Average IC as a function of total length of resequenced DNA. (Same data as in fig. 1 but with rescaled X ordinates.) The bottom X-axis shows the total length as a fraction of total genomic DNA, under the assumption of 1 cM/Mb. The top X-axis shows the number of sequencing reads per genome (under the assumption of 800-bp reads and a genome size of 3,300 Mb). Both horizontal axes are logarithmic. Symbols and line types are the same as in figure 1.

