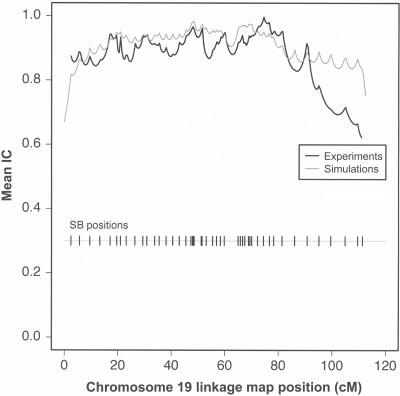
Figure 3.
IC obtained from CEPH families as a function of linkage map position along chromosome 19. Curves reflect the average at each position over all pedigrees in the data set (12 in the experiments; 1,000 in the simulations). The bar with vertical lines depicts the locations of the SBs on the genetic map.

