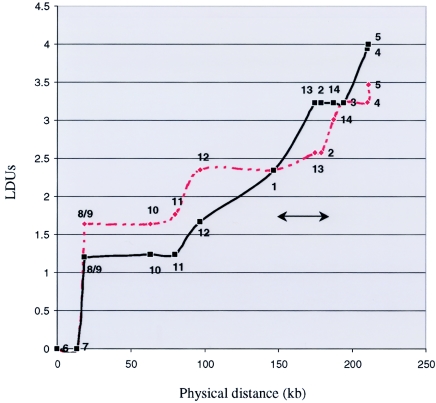
Figure 3.
LD units are shown with respect to the physical position of H1-SNPs across the CRHR1-MAPT loci (Maniatis et al. 2002). H1-SNPs 1–14 are indicated on each curve. Probable PD cases (red dashed line) and controls (black solid line) each consist of matched groups of 81 individuals homozygous for H1/H1 (as defined by the intron 9 in/del [Baker et al. 1999]). The H1 subhaplotype overrepresented in patients with PD, as defined by H1-SNPs 1 and 2, is indicated (bar with arrows).

