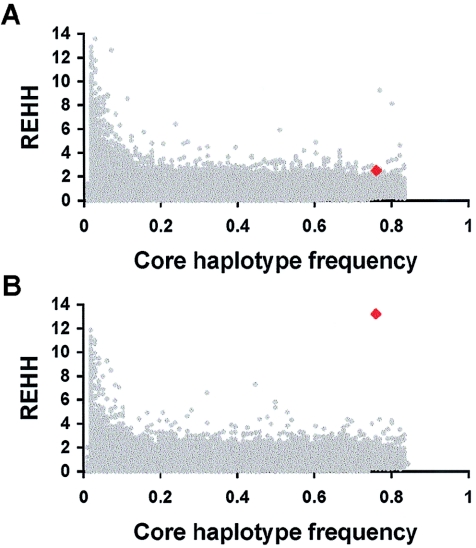
Figure 3.
REHH, a measure of extended haplotype homozygosity, plotted for the persistence-associated haplotype at LCT, in comparison with REHH from haplotypes in 10,000 sets of simulated data (Sabeti et al. 2002). Data are shown using markers (a) 5′ and (b) 3′ to the core region. Data for the LCT-persistence-associated haplotype are indicated by red symbols, and data from simulations are indicated by gray symbols. REHH distributions from actual genotypes for 12 control regions were consistent with the simulated distributions (data not shown).

