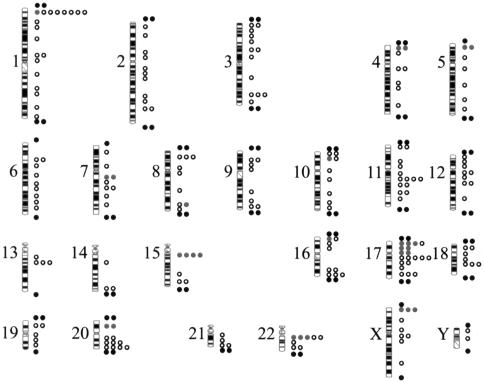
Figure A1.
Schematic ideogram representation of the genomic clone coverage of the GenoSensor Array 300. Clones corresponding to each unique telomere region are represented by black circles, clones for all microdeletion syndromes are shown as gray circles, and additional selected loci representing each chromosome arm are depicted as white circles.

