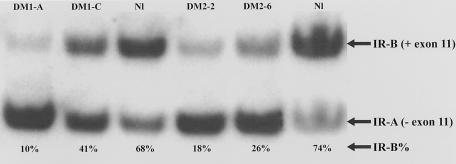
Figure 1.
Measurement of IR isoforms: RT-PCR analyses of IR isoforms in RNA from DM1, DM2, and normal muscle biopsies. The upper band represents the insulin-sensitive IR-B isoform (containing exon 11), and the lower band shows the insulin-insensitive IR-A isoform (without exon 11). In DM1 and DM2 muscle, the IR-A isoform predominates, as evidenced by the low percentage of IR-B relative to that in unaffected control.

