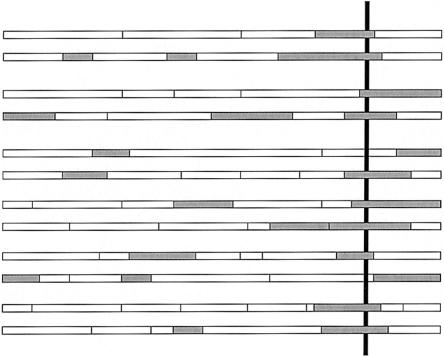
Figure 1.
Schematic figure showing the mosaic structure of chromosomes in an admixed population. The shaded and unshaded boxes indicate chromosomal segments derived from different ancestral populations. If a susceptibility allele is at a higher frequency in the shaded population, then affected individuals will have increased ancestry from the shaded population at the locus of that gene (vertical line). Our method aims to detect this type of signal.

