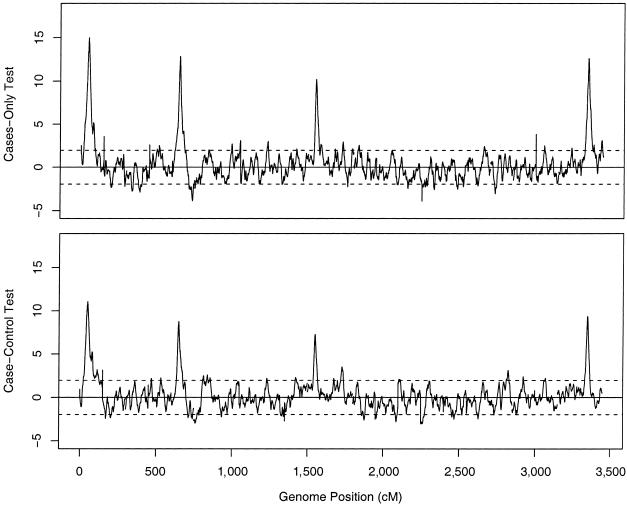
Figure 10.
Mapping results for a simulated genome scan of 500 cases and 500 controls, with four true disease loci. The upper and lower plots show results for the cases-only and case-control tests, respectively. The four large upward peaks on each plot correspond to the four simulated disease loci; for most of the remainder of the genome, the test statistics lie within the dotted lines at ±1.96, corresponding to the central 95% of the null distribution.

