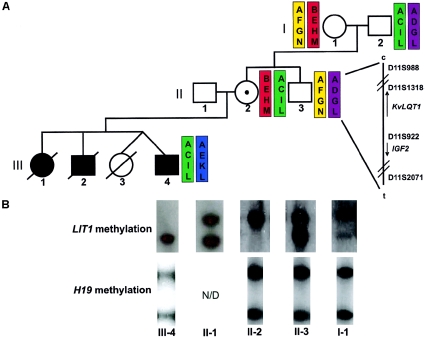
Figure 1.
Haplotype and methylation analysis of LIT1 microdeletion. A, Haplotype mapping using 11p15 microsatellite markers D11S988, D11S1318, D11S922, D11S2071, which were amplified using FAM-labeled primers and detected using an ABI 3100 capillary electrophoresis instrument. Haplotypes were constructed using peak size data (see fig. A [online only]). The haplotypes of individuals I-1 and II-3 are inferred. B, Methylation at LIT1 and H19, assayed by methyl-sensitive Southern blotting using genomic DNA from the indicated individuals. For LIT1, the upper band (6.0 kb) is methylated and represents the maternal allele, and the lower band (4.2 kb) is unmethylated and represents the paternal allele. For H19, the upper band (1.8 kb) is methylated and represents the paternal allele, and the lower band (1.0 kb) is unmethylated and represents the maternal allele. LIT1 shows gain of methylation in II-2 and loss of methylation in III-4. H19 is unaffected.

