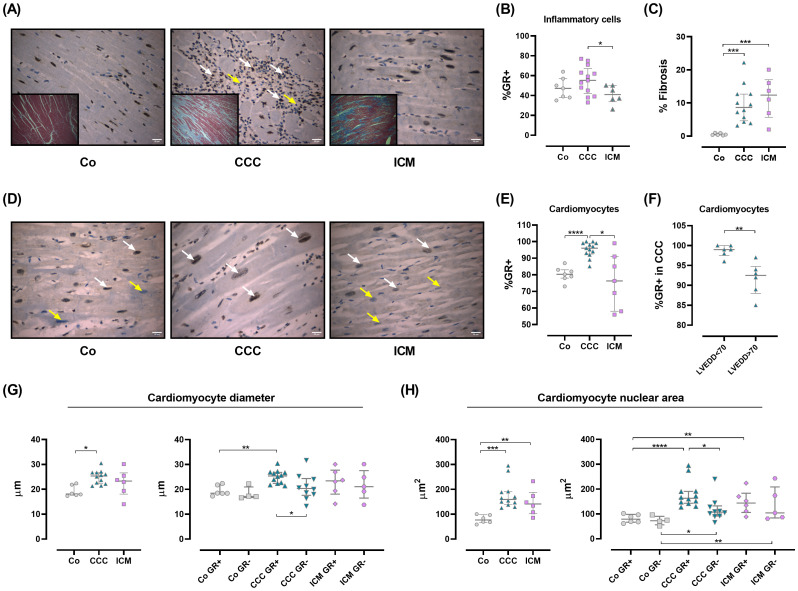
Figure 3.
Glucocorticoid receptor expression in human cardiac tissue samples. (A) Representative images of hematoxylin/eosin staining from the interventricular septum in Co, CCC, and ICM individuals (O.M 400X). A diffuse inflammatory infiltrate is observed in CCC patients (middle panel, white arrows). Inserts show fibrosis for each group. (B) Percentage of GR+ inflammatory cells in 10 HPF (O.M 400X). (C) Fibrosis as a percentage of the total area. (D) GR localization and immunoreactivity. GR+ cells (brown) are mainly nuclear (white arrows); yellow arrows indicate GR-negative cells (light blue). (E) GR+ expression in cardiomyocytes, quantified in 10 HPF (O.M 400X). (F) GR+ expression in CCC patients, categorized by LVEDD. (G) Cardiomyocyte diameters (right panel) and comparison by GR expression (left panel). (H) Cardiomyocyte nuclear areas (right panel) and comparison by GR expression (left panel). Data are means ± SEM. *p<0.05; **p<0.01; ***p<0.001; ****p<0.0001. HPF, high power field; O.M., original magnification.

