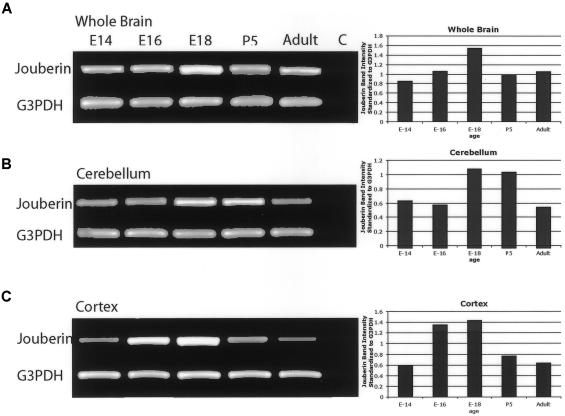
Figure 5.
RT-PCR of Ahi1 (Jouberin) expression in mouse whole brain, cerebellum, and cortex, at different time points. Band-intensity quantification (standardized against G3PDH controls) revealed that Jouberin showed increasing and then decreasing expression as development progressed. Maximum expression occurred in the cerebellum at E18 and P0, and maximum expression occurred in the cortex at E16 and E18. Decreased but persistent expression in the adult was also evident. G3PDH controls are shown below. C = negative control.

