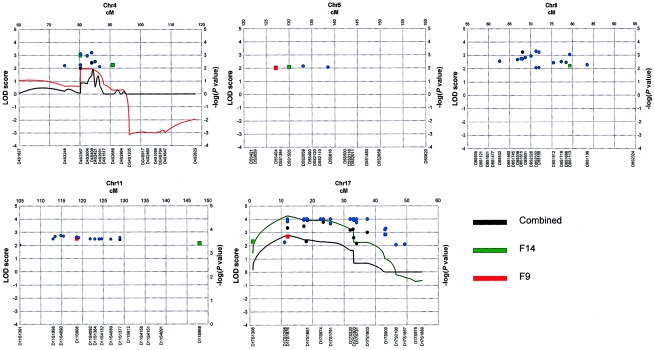
Figure 3.
Linkage results of the fine mapping of five regions (4q13.2, 5q33.3, 8q11.23, 11q22, and 17p11) in 16 families with ADHD. Two-point LOD scores >2.0 per chromosome (as estimated by FASTLINK), for a recombination value of θ=0, are shown as blackened circles; −log (P value) of the two-point NPL E-STAT >2.0 per chromosome for each marker (as estimated by SIMWALK2) are shown as blue circles and triangles (significant combined results), and −log (P value) of the PDT Z statistic values >2.0 per chromosome at each marker for the whole set of families are indicated as green (conferring susceptibility) and red (conferring protection) squares. Two different symbols at the same marker indicate either two positive families or, in the case of NPL statistics, a combined positive result for the whole set of families. Two squares at the same marker indicate either that two alleles are in LD or that there was concordance between the two kinds of PDT (i.e., sum and average). Multipoint location scores, as estimated by SIMWALK2, for those families exhibiting scores >2.0 in any region of the chromosome, are presented as colored lines. Black lines represent the parametric multipoint location scores per chromosome in the combined families.

